
GBIF occurrence maps: count the records before interpreting the wildlife
A cluster of dots on a GBIF map can show where records have been published. By itself, it cannot tell you where a species is most abundant. An empty patch can reflect missing observations, and a precise-looking pin can represent an uncertain or generalized location. To check a claim built from the map, open the records and identify what was observed, when, where and under which sampling method.
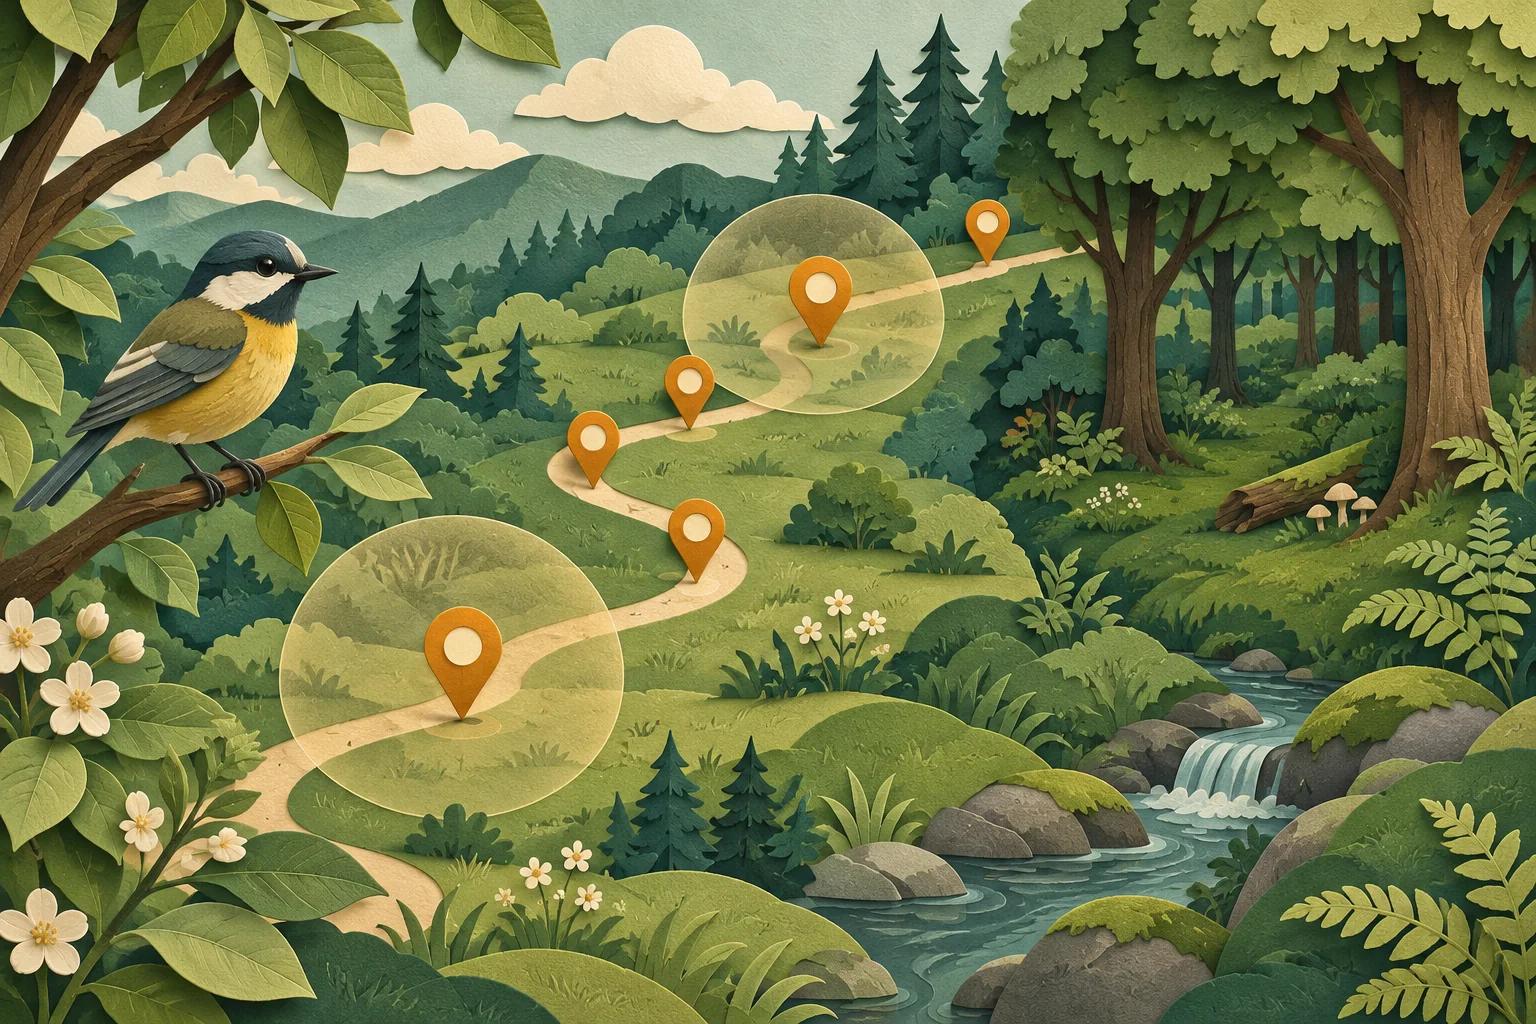
What is one dot allowed to stand for?
GBIF, the Global Biodiversity Information Facility, makes biodiversity records from many publishers discoverable. An occurrence record describes a taxon at a place and time. A taxon is a named biological group, such as a species. The record may concern an observation or a preserved specimen; read basisOfRecord rather than assuming every row is a recent sighting.
The number of records is not necessarily the number of individual organisms. A row may describe several individuals, repeated visits may record the same animal, and collection material may come from a historical expedition. Count what the data actually defines before choosing a label for the chart.
For comparing populations, method matters. Sampling-event data includes information about effort and protocols. An opportunistic observation made during a walk and a standardized survey answer different questions. GBIF’s freshwater publishing guide explains why opportunistic counts without planned effort do not support straightforward abundance estimates.
Audit three records before trusting the whole map
Choose a record from a dense area, one from an isolated point and one that seems inconsistent with the claim. This is a diagnostic sample, not a statistical quality estimate. For each, read:
- Identity and source: scientific name, record identifier, dataset and publishing institution. Check whether the interpreted name differs from the supplied one.
- Time: the observation or collection date, usually represented by
eventDate. A recent dataset update does not make an old observation recent. - Location: coordinates,
coordinateUncertaintyInMeters, and any statement that coordinates were generalized or information withheld. - Collection method: record type, sampling protocol and effort where available. Note missing fields explicitly.
GBIF’s data-quality training describes records placed at administrative centroids or grid centres. A pin can therefore look more exact than the underlying evidence. An empty uncertainty field does not mean zero error. Do not try to reconstruct locations deliberately generalized to protect sensitive species.
Also review occurrence issue flags, such as coordinate or date inconsistencies. A flag is a reason to investigate the relevant field. Removing all flagged records without documenting the rule can silently change the population of records you are describing.
The trail with eighteen records
Fictional exercise: the bird, places and counts below are invented. They are not a GBIF download or a field survey. Suppose a map caption says, “The east woodland has six times as many birds as the west woodland.” The underlying teaching packet contains:
| Record group | Rows | What the packet actually says |
|---|---|---|
| East trail | 18 | One observer’s opportunistic records across six walks; time spent is not recorded |
| West woodland | 3 | One short visit by a different observer; route and duration unknown |
| Central map pin | 1 | A specimen collected in 1952; locality generalized to a grid centre |
The arithmetic 18 ÷ 3 = 6 is correct. Its label is wrong: it compares rows, not population sizes. The visits differ, observation effort is unknown, and the packet does not identify unique birds. The central pin adds a separate problem: counting it as a current observation at the exact point would change both time and location.
Rewrite the caption: “This teaching packet contains 18 records from east-trail walks and three from a west-woodland visit. The counts are not adjusted for observation effort and do not estimate bird abundance. A separate historical specimen has a generalized location.”
Now ask what would make a stronger comparison possible: matching seasons, comparable routes and durations, a consistent protocol, and a way to account for detection and repeated observations. More dots alone do not supply these missing conditions.
Leave a map caption someone can check
Keep the taxon filter, area, date range, included record types, retrieval date and dataset or download citation with the figure. Describe what each dot or aggregate represents. If you excluded uncertain locations, record the criterion and how many rows it removed; do not quietly turn unknown uncertainty into a numerical value.
For a deeper audit, GBIF’s download-format documentation distinguishes interpreted occurrence data from the original fields in verbatim.txt. It also notes that a Simple CSV download is tab-separated. Use the identifier-preserving import checklist when opening it in a spreadsheet, and the coordinate-format checks before transferring points to another map.
The useful output is a qualified map statement with a reproducible source trail. If the data only supports where observations were recorded, say that. A map does not become a wildlife census because it looks complete.
By OSINT Jet · Published 3 November 2026 · Primary sources checked 3 November 2026.