
Photo analysis · Counting claims
How many people are in this photo? Build a crowd estimate you can explain
“Five thousand people attended.” Under the claim sits a photograph of a busy square. Before counting heads, decide what the number means. Is it the number inside the square at the moment of the photograph, the peak crowd, or everyone who visited during the afternoon?
A single photograph can support an estimate of people visible within a defined area at a particular moment. It usually cannot establish total attendance over several hours. The practical calculation is occupied ground area multiplied by a plausible density, performed separately for sections that look different. The useful result is a range with visible assumptions, not an impressive-looking exact total.
Write the claim before measuring anything
Make one sentence that includes a population, place and time: “People standing inside the marked square at 14:10.” This is your counting boundary. Keep staff, people under cover and anyone outside the frame explicit: included, excluded or unknown.
If the post claims all-day attendance, you need information about arrivals, departures and repeat visits. Adding the counts from three photographs would count many of the same people more than once. A small instant crowd does not disprove a much larger total passing through over a day.
Also verify the image’s place and time before treating it as evidence for an event. If the location is uncertain, start with our guide to locating an image without metadata. Arithmetic cannot rescue a photograph of the wrong square.
Measure ground space, not the whole rectangle of the image
Use a mapped outline, a reliable site plan or independently established dimensions to estimate the ground area. Check that the plan represents the layout in the photograph. A square that has acquired a stage, fenced work zone or row of stalls has less usable standing space than its full mapped outline suggests.
Mark obstacles first: buildings, fountains, stages, vehicles and empty routes. Subtract them rather than assigning them the density of nearby people. Treat an area hidden behind a building as unknown, not empty. You may be able to estimate the visible sections while leaving that blind spot outside the result.
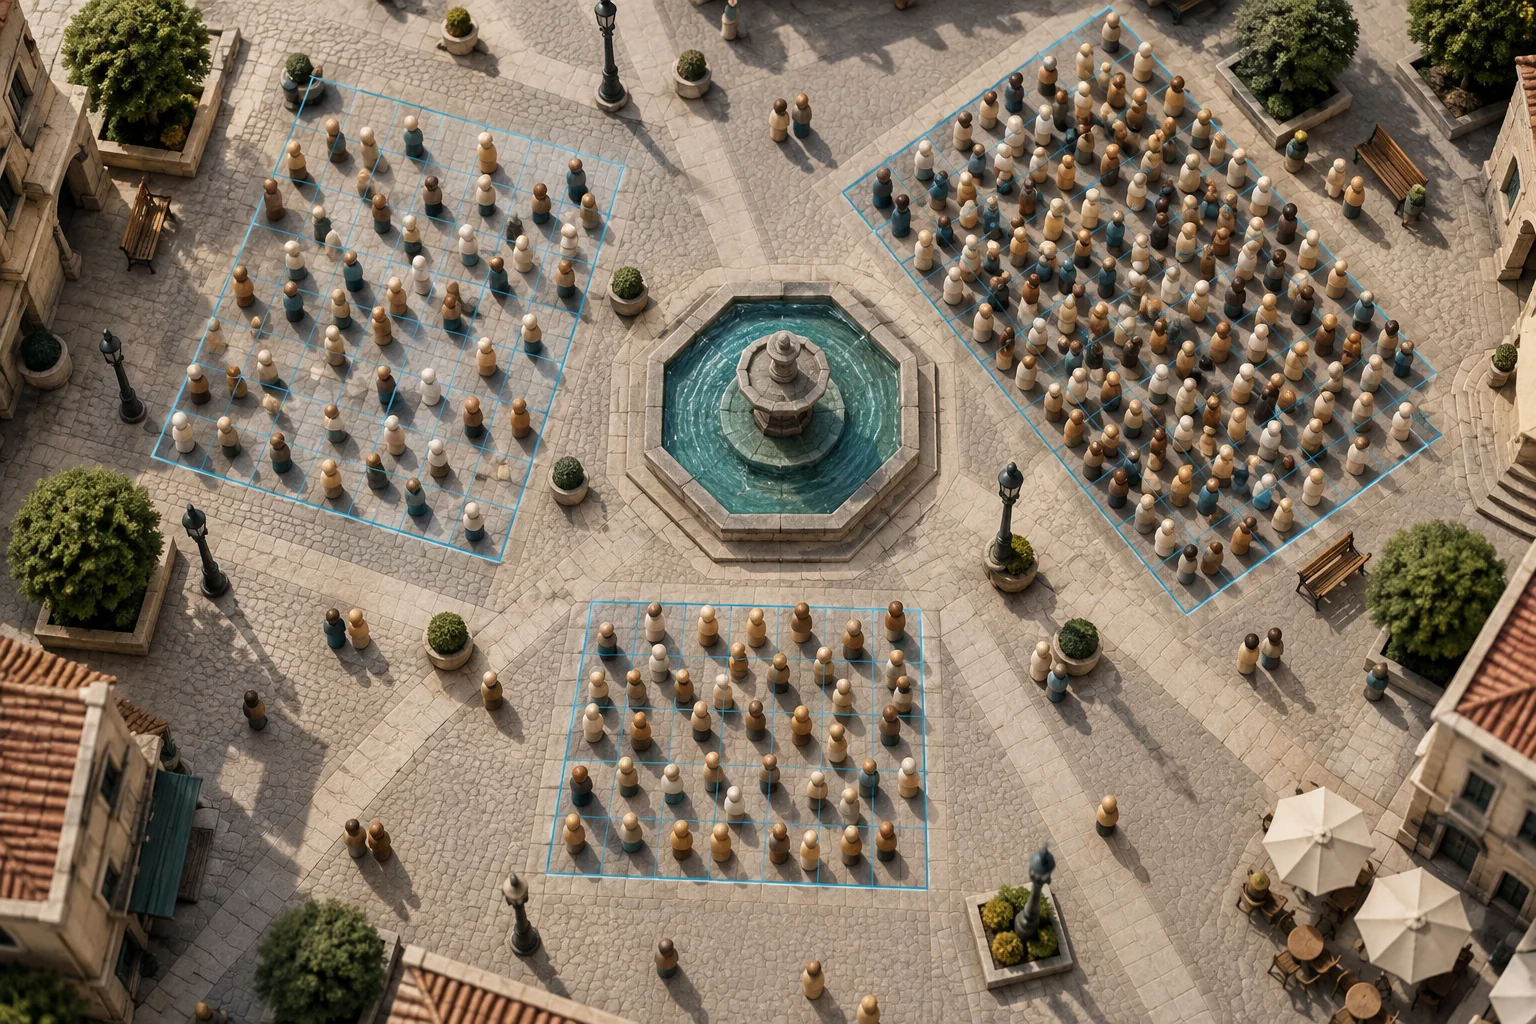
An angled photo needs extra care. Equal-sized boxes drawn across the image do not represent equal-sized areas on the ground. A foreground group can fill far more pixels than an equally large group at the back. Do not count a close patch and multiply it across uncorrected image tiles.
Split dense and sparse sections
When people are individually distinguishable, count a small patch whose ground area you can establish, then divide the people count by that area. Repeat with other patches in the same zone. The spread helps you choose a range for that zone, although it does not automatically create a statistical confidence interval.
When people are not distinguishable, explain why the chosen density range is plausible and widen or withhold the estimate if the evidence is weak. Do not assign one density to a packed foreground, scattered rear group and clear walkway. Keith Still’s counting work emphasizes this uneven distribution and the value of viewing a crowd from more than one direction.
Extra images help only if you can align their time and coverage. A rear view taken half an hour later is useful context, but it cannot simply fill the blind spot in the earlier photograph.
A fictional square, calculated section by section
This teaching example assumes a verified overhead view of a public market at 14:10. All figures are invented. The square’s outlined area is 1,000 m²; 100 m² contains a fountain, stalls and clear paths. The remaining 900 m² is divided into three visible zones. The densities below are exercise assumptions, not standard crowd-density values or safe-capacity limits.
| Zone | Occupied area | Assumed people per m² | Estimated people |
|---|---|---|---|
| Front group | 420 m² | 1.4–1.8 | 588–756 |
| Side group | 300 m² | 0.6–1.0 | 180–300 |
| Rear group | 180 m² | 0.2–0.5 | 36–90 |
| Total visible zones | 900 m² | Calculated separately | 804–1,146 |
For the front zone, the lower calculation is 420 × 1.4 = 588. Add the three lower estimates, then the three upper estimates. The result is about 800–1,150 people in the outlined visible zones at 14:10, under the stated density assumptions.
Those final digits do not mean the image is accurate to one person. Rounding communicates the resolution of the evidence more honestly. Keep the unrounded arithmetic in the worksheet so someone else can reproduce it.
Test the assumption that matters most
Suppose every occupied-area measurement might be 10% smaller or larger. Holding the density ranges fixed, the low scenario becomes 804 × 0.9 = 723.6 and the high scenario becomes 1,146 × 1.1 = 1,260.6. You would report roughly 720–1,260 for that combined scenario.
This is a sensitivity calculation. It is not a 95% confidence interval, and it does not account for every possible error. If you cannot justify the density range, adding decimal places or a percentage label will not fix the problem. If the hidden area could contain a substantial group, say the total crowd is unresolved.
Return to the original claim. “Five thousand in the outlined visible zones at 14:10” is not supported by this example’s assumptions. “Five thousand visitors across the afternoon” remains a different question; these calculations do not answer it.
Make the estimate reviewable
Save the source image URL, retrieval date, evidence for capture time and location, marked boundary, excluded areas and the per-zone calculations. Record the source of each area measurement and the reason for each density range. Preserve a clean source image alongside any annotated working copy.
A useful conclusion might read: “The three visible zones support an estimated 800–1,150 people at the photographed moment under the listed density assumptions. A ±10% area scenario broadens this to about 720–1,260. The covered passage and people outside the frame are uncounted; total event attendance is not established.”
If the unresolved question is who first published the image or whether its caption changed, switch tasks rather than refining an unsupported count. OSINT Jet’s image OSINT page introduces image research routes you can use to investigate context. It should not be read as a promise of automated crowd counting. Neither this estimate nor its illustration is a venue safety assessment.
Sources and method boundaries
- G. Keith Still: crowd counting, the researcher’s discussion of occupied area, distribution and viewing angles.
- Choi-Fitzpatrick and colleagues: crowd estimation from aerial imagery, an author-hosted draft dated 23 January 2017. Its static, flat-ground setting is a useful reminder that a method’s assumptions matter; it is not a validation of the fictional calculation above.
Published 16 October 2026 · OSINT Jet